Portfolio Performance Evaluation
Unit 4 SAPM Notes
Sharpe and Treynor Portfolio Performance Measures
The Sharpe Measure
In this model, performance of a fund is evaluated on the basis of Sharpe Ratio, which is a ratio of returns generated by the fund over and above risk free rate of return and the total risk associated with it. According to Sharpe, it is the total risk of the fund that the investors are concerned about. So, the model evaluates funds on the basis of reward per unit of total risk. Symbolically, it can be written as:
Sharpe
Index (St) = (Rt - Rf)/Sd
Where, St
= Sharpe’s Index
Rt=
represents return on fund and
Rf=
is risk free rate of return.
Sd=
is the standard deviation
While a high and positive Sharpe Ratio shows a superior
risk-adjusted performance of a fund, a low and negative Sharpe Ratio is an
indication of unfavorable performance. This index gives a measure of portfolios
total risk and variability of returns in relation to the risk premium. This
method ranks all portfolios on the basis of St. Larger the value of St, the
better the performance of the portfolio.
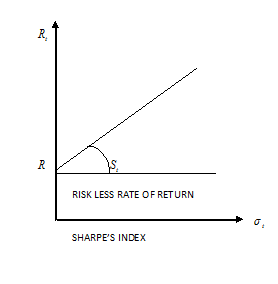
The following figure gives a graphic representation of Sharpe’s index. Sd measure the slope of the line emanating from the risk less rate outward to the portfolio in question.
|
Portfolio
|
Average
return
|
S.D.
|
Risk
Free Rate
|
|
A
|
15%
|
3%
|
9%
|
|
B
|
20%
|
8%
|
9%
|
Advantages of Sharpe’s Ratio:
a) The main advantage of this ratio is that it is easy to
calculate and it is used widely.
b) This index gives a measure of portfolios total risk and
variability of returns in relation to the risk premium.
c) The Sharpe ratio also
standardizes the relationship between risk and return and therefore can be used
to compare different asset classes i.e., comparison of stocks with commodities.
d) An advantage of Sharpe ratio is that a beta
estimate is not required.
Disadvantages of Sharpe ratio:
a) When risk free rate is known, it is very
difficult to find the right expected return and standard deviation. In a stable
market, it is very easy to predict expected return but in today’s dynamic
market it is very difficult to predict future expected return.
b) This ratio is not appropriate when evaluating
individual stocks because it uses total risk rather than systematic.
c) It is overstated if the return are smoothen
and historical prices are used.
d) It can be manipulated by the fund managers if non-linear derivatives are used.
The Treynor Measure
Jack L. Treynor based his model on the concept of characteristic
line. This line is the least square regression line relating the return to the
risk and beta is the slope of the line. The slope of the line measures
volatility. A steep slope means that the actual rate of return for the
portfolio is highly sensitive to market performance whereas a gentle slope
indicates that the actual rate of return for the portfolio is less sensitive to
market fluctuations.
The Treynor index, also commonly known as the reward-to-volatility
ratio, is a measure that quantifies return per unit of risk. This Index is a
ratio of return generated by the fund over and above risk free rate of return,
during a given period and systematic risk associated with it (beta). The portfolio beta is a measure of
portfolio volatility, which is used as a proxy for overall risk – specifically
risk that cannot be diversified. A beta of one indicates volatility on par with
the broader market, usually an equity index. A beta of 0.5 means half the
volatility of the market. Portfolios with twice the volatility of the market
would be given a beta of 2. Symbolically, Treynor’s ratio can be
represented as:
Treynor's
Index (Tt) = (Rt
– Rf)/Bt
Whereas,
Tt = Treynor’
measure of portfolio
Rt = Return of
the portfolio
Rf = Risk free
rate of return
Bt = Beta
coefficient or volatility of the portfolio
All risk-averse investors would like to maximize this value. While
a high and positive Treynor's Index shows a superior risk-adjusted performance
of a fund, a low and negative Treynor's Index is an indication of unfavorable
performance. Treynor ratios
can be used in both an ex-ante and ex-post sense. The ex-ante form of the ratio
uses expected values
for all variables, while the ex-post variation uses realized values.
|
Portfolio
|
Return
|
Volatility
|
Risk less Rate
|
|
A
|
20%
|
5%
|
8%
|
|
B
|
24%
|
8%
|
8%
|
Advantages of Treynor’s ratio:
a) The main advantage to the Treynor Ratio is that it indicates
the volatility a stock brings to an entire portfolio.
b) The Treynor Ratio should be used only as a
ranking mechanism for investments within the same sector. In a situation
where rate of return from various investments alternatives are same,
investments with higher Treynor Ratios are less risky and better managed.
c) It is proper measure for diversified
portfolio.
d) This method is easy to calculate and simple to
understand.
Limitations of Treynor’s ratio:
a) It is only a ranking criterion. It does not consider any values
or metrics calculated by means of the management of portfolios or investments.
b) A Treynor ratio is a backward-looking design. This ratio gives
importance to how the portfolio behaved in pas. It is possible that a portfolio
may perform differently in future from how it has done in the past.
c) Weakness of Treynor’s ratio is that it requires an estimate of
beta, which can differ a lot depending on the source which in turn can lead to
mis-measurement of risk adjusted return. Many investors accomplish that a beta
cannot give a clear picture of risk involved with the investment.
d) It can be overstated if market neutral strategies are used and
assets used in the portfolio are highly leveraged.


